X-Ray Physics: Signal-to-Noise in Fluoroscopy
This simulation illustrates the effects of changing exposure, kV, or pixel size on signal and noise in fluoroscopy (or radiography). For typical fluoroscopy images, exposure ranges from 1-5 μR; digital subtraction angiography has exposures in the range of 50-100 μR. In the abdomen of a normal-sized patient with a grid, a scatter to primary ratio of 0.7 is reasonable.
|
Tube kV Scatter : Primary ratio μR / image Pixel binning SNR: |
|
|
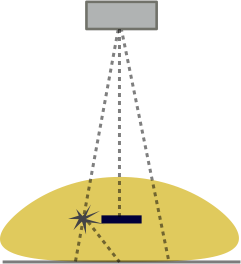
Illustration of how small cavities filled with iodine contrast in the middle of the patient's abdomen might appear.
Image Quality and Information in Radiology
Before even discussing the signal-to-noise ratio (SNR), we need to take a step back and think about what the goal is of the imaging process in the first place. Specifically, each imaging exam is intended to gain a certain piece of information about the patient. Since there are drawbacks to imaging such as time, dose, and (in the case of angiography) intervention, we need to minimze our imaging to what is necessary to make a diagnosis.
There is a difference between image quality, i.e. how 'pretty' images look, and image information, i.e. how well we can make a diagnosis from the image. While a certain level of image quality is necessary for diagnosis, as radiologists we can often make diagnoses on images with noise, artifacts, and poor resolution. As noted above, we must perform exams at a point which balances image quality with harms to the patient.
Signal. The signal is the same as the information contained in the image - it is the finding we are looking for. Various parameters affect the strength of the signal (and it depends on how you define signal). For purposes of this discussion, we will note that often tissue contrast is the signal we are looking for. For example, how can we distinguish a liver metastasis from the rest of the liver; or, how can we distinguish the blood in a pulmonary artery from a thrombus. Tissue contrast is determined differently in MRI (by the T1 and T2 parameters) from x-ray imaging (where it is the x-ray attenuation coefficient). In x-ray imaging such as fluoroscopy, as is our focus in this section, the contrast depends on the material and on the x-ray energy used. As discussed more in the section on tissue contrast, materials such as iodine attenuate x-rays much more than soft tissues. Additionally, low-energy x-rays discriminate between different tissues much better than high-energy x-rays do. Thus, we can improve our contrast by adding iodine contrast material or by reducing x-ray energy.
Noise and SNR
Noise. Generically, noise is any extraneous information in the image that obscures the signal. Noise comes from physical processes in the image acquisition and detection as well as from the reception and processing electronics. In MRI, electronic noise in the receiver coil and hardware forms a large portion of the noise seen in images. Ways to decrease noise might include using surface coils instead of volume coils, decreasing bandwidth, or increasing the number of phase-encoding steps or averages; see more in the section on MRI image formation parameters. In x-ray examinations, studies are done at the lowest radiation dose possible, so images are limited by statistical noise from the radiation interaction itself - so-called quantum limited. The noise results from random variations in the number of photons (the quanta of light) that are generated, pass through the patient, and interact with the detector; this noise is referred to as quantum mottle.
While a deep discussion of quantum mottle is beyond the scope of this section, it is worthwhile to know how the noise behaves. Quantum mottle follows the Poisson distribution - a statistical distribution that bears some resemblance to the normal (Gaussian) distribution as the number of photons becomes large. Importantly, the mean of the Poisson distribution is the number of photons and the standard deviation is the square root of the number of photons. In other words, if the number of photons is N then x-ray detectors will measure on average
x̄ = N with standard deviation σ = √N
In other words, even if we have a signal S, such as an enhancing liver lesion, we can't actually measure S. Instead, we measure the photons that come through, which on average gives S but with some random variation. This variation represents the noise - and as you can see, noise goes down with increasing number of photons. Obviously, we can't just use tons of photons because dose is proportional to the number of photons we shoot into the patient. Thus, we need to obtain images at a level where the noise is acceptable and does not overwhelm the signal.
SNR. The signal-to-noise ratio (SNR) is a quantitative way of expressing how noise compares to the signal. In other words, if our signal is really strong (black and white), then even a large amount of noise isn't a problem. On the other hand, if our signal is weak, such as a subtle liver lesion, then even a small amount of noise can create a problem. Sometimes, the term contrast-to-noise ratio (CNR) is used with a similar meaning. If the signal is expressed as a contrast in the image, then we can express the signal S as a change in the background intensity I determined by the contrast C. In other words
S = C * I
Note that the background intensity is just the number of photons that pass through - which we will call N - so we can just replace I with N. And remember that noise = σ = √N. Therefore,
S = C * N so SNR = S/σ = C * N / √N = C * √N
In other words, in x-ray imaging, SNR increases with dose* - specifically, with the square root of the number of photons. (*Here I mean if you increase the number of photons specifically; the relationship between SNR and kV is more complex since kV changes the contrast as well.)
Decreasing noise. Instead of actually increasing the number of photons shot into the patient, we can improve image noise in other ways. For example, in fluoroscopy we can use time averaging to average images over successive moments in time and reduce noise (since quantum mottle is random and changes over time). Improvements in x-ray detectors improve the number of photons that are captured by the detector - it turns out that many photons actually pass through the detector and thus do not contribute to the image. Improvements in the detector may also decrease any electronic noise that degraded the image.
Pixel binning. One additional - and easy - method to improve noise is by pixel binning. We can combine several adjacent pixels in an electronic (flat-panel) detector into one pixel we display on the screen - combine them into one 'bin'. That way, we have more photons - and less noise.
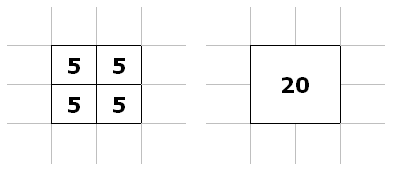
Illustration of a 2x2 group of adjacent pixels (left) binned into one, larger pixel (right). Instead of 5 photons for each pixel, the new bin gets 20 photons.
From combining a 2x2 group of (4) pixels into one, we gain:
SNR = C * √4 * N = 2 * C * √N
For the 4 times as many photons we get from combining 4 pixels into 1, we gain a doubling of SNR. Of course, we lose resolution (by a factor of 2 in each dimension), but often we can get by with slightly poorer resolution. Often, flat-panel detectors use binning at their default, full field-of-view setting and turn it off for magnification modes (thus increasing resolution for the magnification). This is discussed further in the section on magnification in radiography.
Scatter
When x-ray photons pass through a patient, many of them are scattered by the tissues (by mechanisms discussed in the section on X-ray interaction with matter. While many of these scattered photons will leave the body entirely (in fact, a good fraction of them come straight back towards the tube), many of them will pass through the body in the forward direction and hit the x-ray detector. Scattered photons travel at oblique angles to the beam and thus are independent of actual tissue attenuation above that point in the detector (the detector doesn't know where they really came from). These contribute a different kind of noise to the image - by decreasing the contrast.
 |
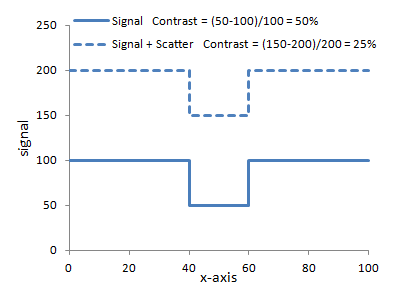 |
Left: Illustration of the concept of scatter. The left ray interacts with an atom in the body and is deflected. Note that it hits the detector right under where a high-attenuating object (e.g. iodine contrast) lies. The detector cannot know better and so assigns an extra photon to that point. Scatter affects the entire image relatively uniformly. Right: Graph of how adding scatter to the image decreases contrast. The same signal with added scatter (dashed line) has lower contrast because of the higher background.
In large body parts such as the abdomen, scatter contributes a large fraction of the detected photons - e.g. around 80%. Often, the amount of scatter is quantified as the Scatter : Primary ratio, i.e. how many photons come from scatter versus travel directly through the patient. (Those that interact with photoelectric effect or are scattered away from the detector do not count at all - and thus contribute to the image contrast!) Scatter : Primary ratios for large body parts can range from 3-6. A Scatter : Primary ratio of 4 means that 20% of the photons are primary while 80% are scatter. As you can see from the right-hand graph above, this severely degrades contrast. With a Scatter : Primary ratio of 4, a 50% contrast is degraded to 10%.
Grids. In order to counteract the effects of scatter, a grid can be used. A grid is a sheet of parallel (or angled) septa that only allow x-rays at certain angles - those coming directly from the tube - to pass through to the detector.
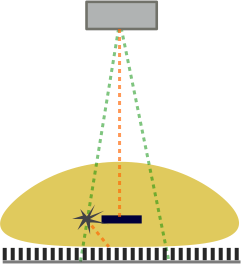
Illustration of the effects of a grid. The primary beams (green) are allowed to hit the detector. However, the scattered beam (orange) hits the septa of the grid and cannot reach the detector since it's at such an oblique angle.
A grid can reduce the scatter events by around 90% (depending on the height and spacing of the septae). Note that grids also block some primary photons and many photons that are scattered by only small angles. The reduction in primary photons may be on the order of 40%. The combination of both effects severely reduces the number of photons reaching the detector. Obviously quantum mottle increases with fewer photons. Additionally, a minimum number of photons is required to develop an image, although this was much more true in the era of film radiography. Overall, the effect is that the use of a grid requires more x-rays to be shot at the patient (increase mA*s). This increases the dose to the patient (but improves image quality substantially). Grids are not necessary in small patients / body parts as scatter is dependent on the thickness of the body part (more opportunities for photons to interact and a wider range of angles that will still hit the detector).
Collimation. A final method of reducing scatter is the use of (pre-patient) collimation. Collimation means restricting the x-ray beam to a small region on the patient, i.e. smaller than the detector can view. By removing x-rays that strike unimportant regions of the patient, you prevent those rays from scattering into the region of interest. In the scatter illustrations above, if the left ray was not there in the first place (collimated from the field of view), then it would never have scattered. Additionally, collimation reduces the radiation to the patient; in particular it reduces DAP, although the dose itself (and the air kerma) will not change. For more details, see the section on magnification and collimation.
Digital Subtraction Angiography (DSA)
Digital subtraction angiography (DSA) is a fluoroscopy technique to obtain clearer images of contrast filling the vascular system. It involves subtracting the background structures present before contrast (e.g. bones) to only show the structures that fill with contrast (e.g. arteries). A mask image is generated before contrast administration. The mask is then subtracted from all subsequent images to generate the angiogram.
DSA has a particular problem with noise because we are subtracting 2 noisy images from each other. The resulting image has more noise because from probability theory we know that for two random processes a and b, the standard deviation σa-b of their difference is
Since the two images have the same amount of noise, we obtain σa-b = √2 * σ
In other words, the noise in the subtracted image is greater by about 41% than the noise in the original images. Additionally, the process of subtraction also yields smaller numbers – thus the variation from the same absolute amount of noise is proportionally larger. In order to countract this, DSA images (both the mask and the subsequent angiographic images) are obtained at much higher doses (approximately 5–10-fold higher) than standard fluoroscopic images. Thus, it is important to limit the use of DSA in order to reduce patient dose.
References
- Bushberg JT, et al. The Essential Physics of Medical Imaging. 3rd Ed.
- Nickoloff EL. "Physics of Flat-Panel Fluoroscopy Systems: Survey of Modern Fluoroscopy Imaging: Flat-Panel Detectors versus Image Intensifiers and More." Radiographics 31(2).
Content and images copyright 2014 Mark Hammer. All rights reserved.